7. Valence Bond Theory in Chemical Reactions
We have already learned the basic concepts of valence bond (VB) theory and its applications to ground and excited states. In this lecture, we will discuss how to apply VB theory to study chemical reactions. We will introduce the concept of the transition state wave function in VB theory and show how VB theory can be used to analyze chemical reactions.
7.1. What is a Transition State?
The essence of a chemical reaction lies in the breaking, forming, and reorganization of chemical bonds under certain conditions, leading to the transformation of the original substances into new substances. The starting point of the reaction is the reactant (R), while the endpoint is the product (P). During the transformation from reactants to products, there exists a special state: at this point, the old bonds have not yet been fully broken, while the new bonds, though partially formed, have not yet been fully established. This special state is referred to as the transition state (TS).
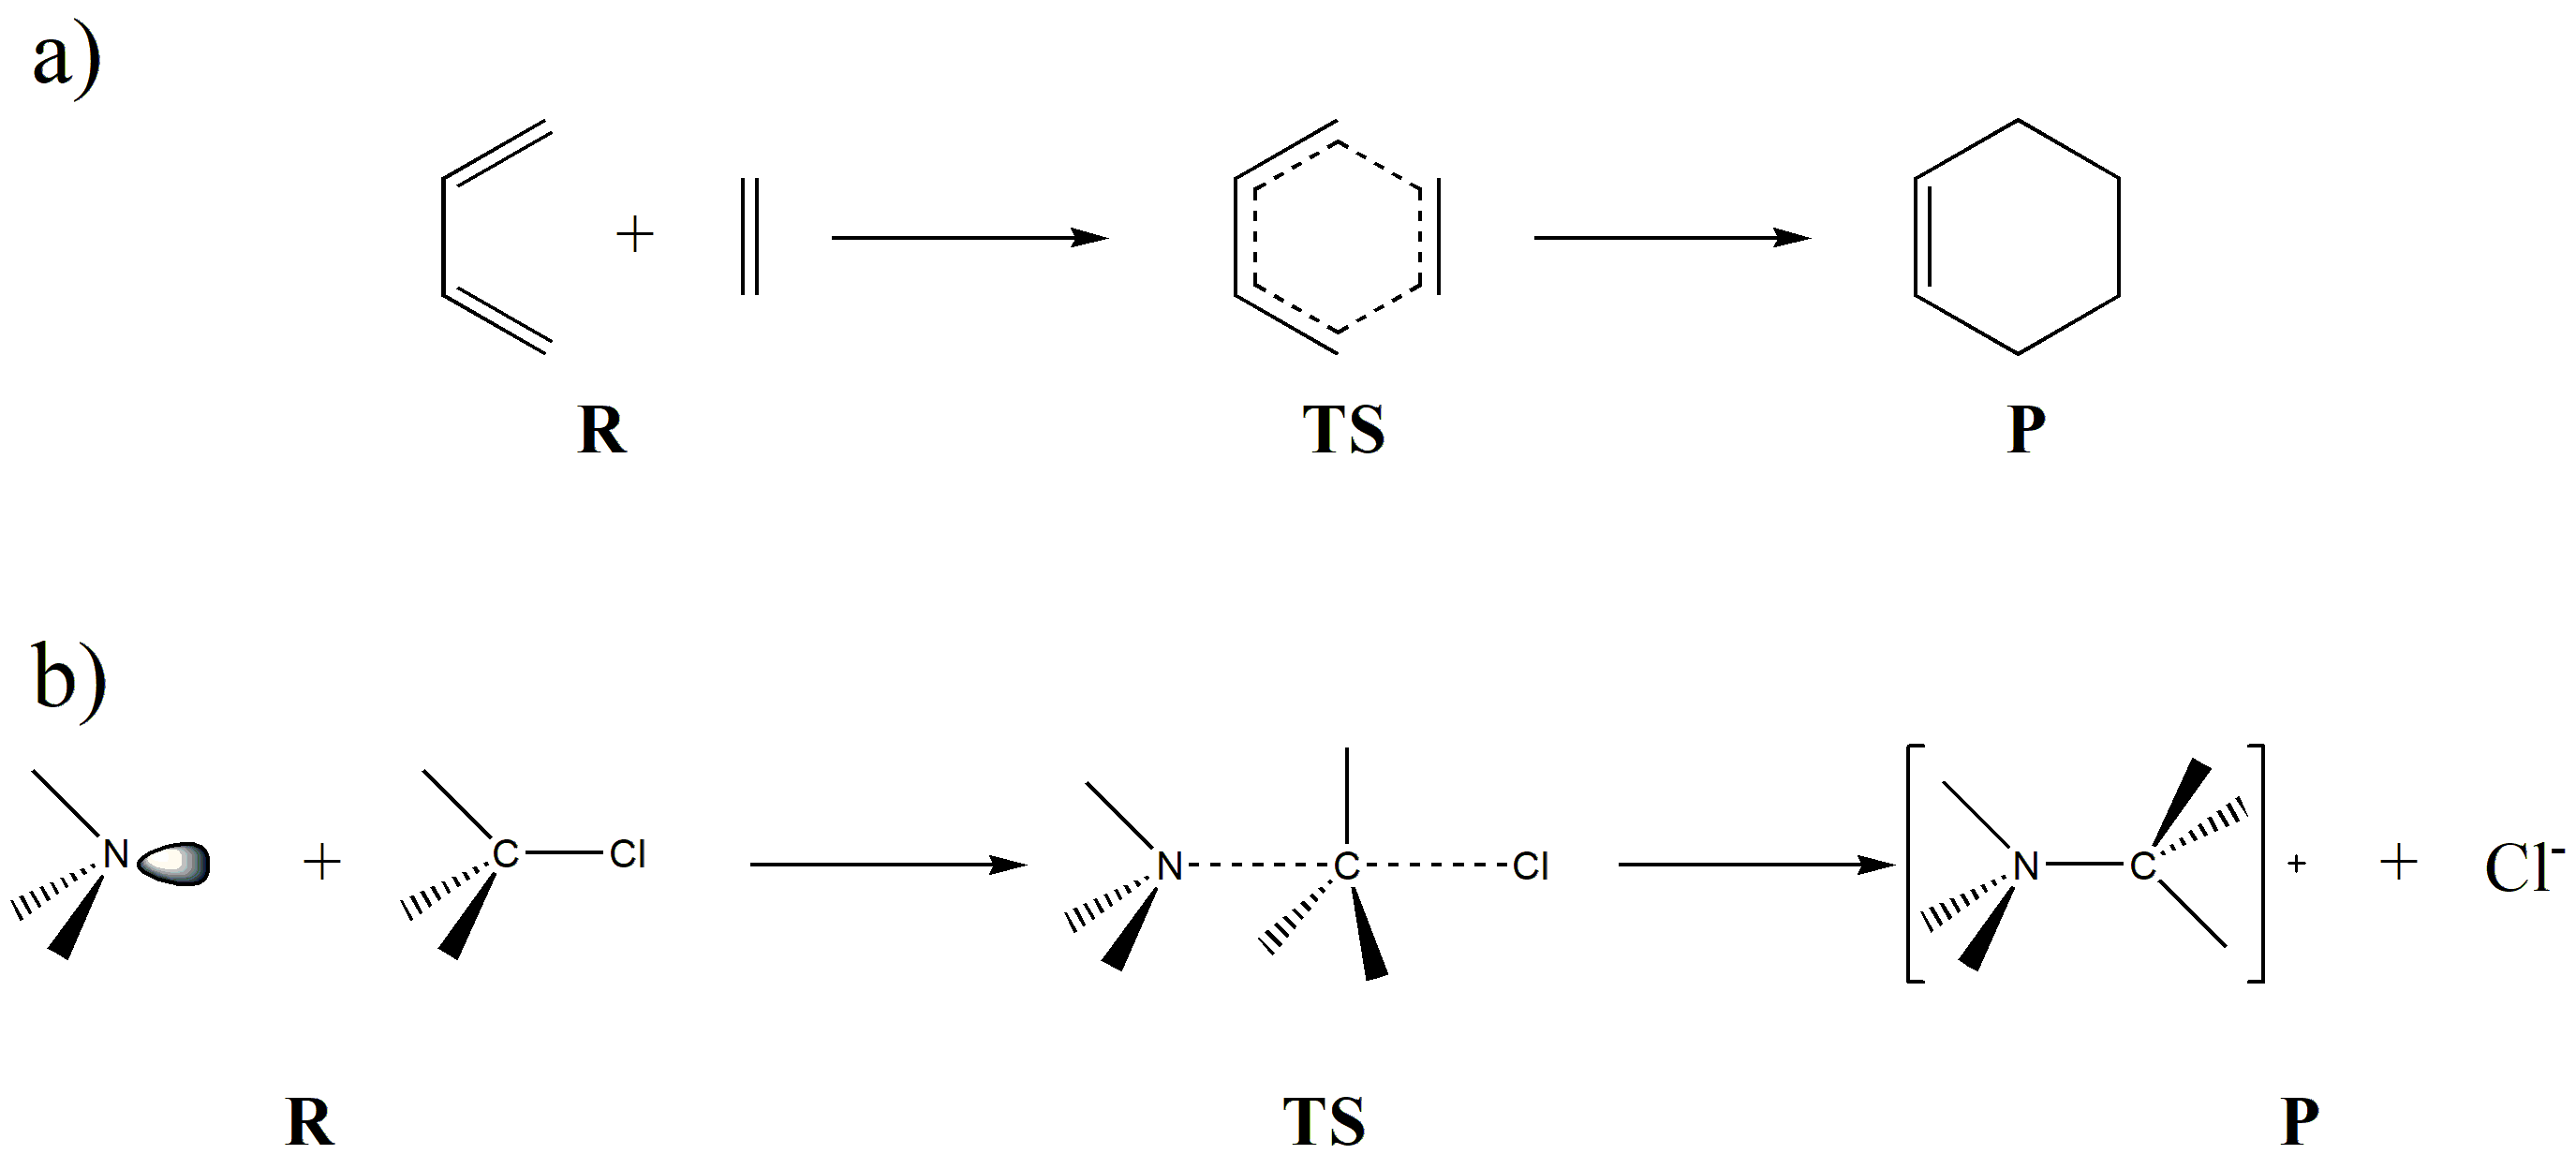
Fig. 7.1.1 Examples of reactants (R), transition states (TS), and products (P) in chemical reactions
Fig. 7.1.1 illustrates two examples of chemical reactions. Reaction (a) is a typical [4+2] cycloaddition, where the transition state has the characteristic of a six-membered ring. Reaction (b) is a typical \(S_N2\)reaction, where in the TS the C–N bond is not fully formed while the C–Cl bond is not fully broken, resulting in a transition state where the carbon atom simultaneously exhibits bonding interactions with both N and Cl.
On the potential energy surface of a reaction, the transition state corresponds to the highest-energy point. The energy difference between the TS and the reactants determines the barrier that must be overcome for the reaction to proceed, which is referred to as the activation energy \(E^a\):
7.2. Computing Transition State Wave Functions with XMVB
The procedure for computing a VB wave function of a transition state is essentially the same as that for any other molecule. The only point of caution is that, because the transition state lies between the reactants and the products, its VB wave function must simultaneously contain features of both. In other words, the VB structures included for the TS must cover the bonding characteristics of both reactants and products.
Let us consider the H3 reaction as an example. This is a hydrogen atom transfer reaction, as illustrated in Fig. 7.2.1. In the TS, the central H atom interacts with both of the outer H atoms simultaneously.

Fig. 7.2.1 H3 hydrogen-abstraction reaction
Based on this, we can define an active space of three centers and three electrons. According to the discussion in Section 2, this situation leads to eight possible VB structures, which are shown in Fig. 7.2.2 .
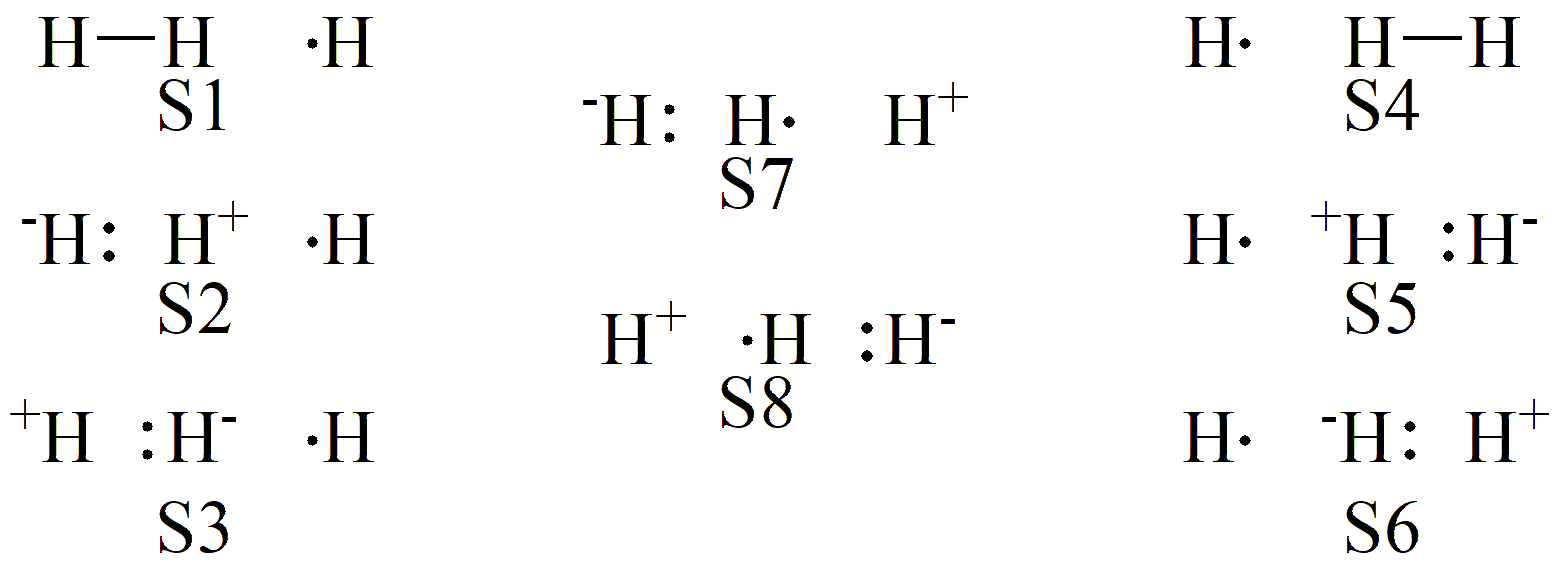
Fig. 7.2.2 VB structures for the H3 hydrogen-abstraction reaction
We can see that the 8 valence bond structures can be clearly divided into three groups: S1–S3 on the left form the first group, mainly describing the bonding characteristics of the reactant R; S4–S6 on the right form the second group, mainly reflecting the bonding characteristics of the product P; and the remaining S7–S8 in the middle form the third group. Below, taking the geometry at the transition state (TS) as an example, we provide the input file:
 1H3 TS
 2$ctrl
 3vbscf
 4str=full nao=3 nae=3 nmul=2
 5iscf=5
 6int=libcint basis=cc-pvdz
 7$end
 8$orb
 91*3
101
112
123
13$end
14$geo
15H  0.0  0.0  -0.93129
16H  0.0  0.0   0.00000
17H  0.0  0.0   0.93129
18$end
The results are summarized in Table 7.2.1 , which lists the structure coefficients and weights:
Structure Coefficient |
Structure Weight |
|
|---|---|---|
S1 |
0.378 |
0.338 |
S2 |
-0.154 |
0.106 |
S3 |
-0.039 |
0.022 |
S4 |
-0.378 |
0.338 |
S5 |
0.154 |
0.106 |
S6 |
0.039 |
0.022 |
S7 |
0.080 |
0.034 |
S8 |
-0.080 |
0.034 |
Because this is a symmetric hydrogen atom transfer reaction, the TS lies exactly at the midpoint of the reaction. As expected, the weights of the VB structures corresponding to reactants and products are equal, which is in excellent agreement with the underlying chemical concept. The same set of VB structures can also be used to compute the wave functions of the reactants and the products.
7.3. Valence Bond State Correlation Diagram (VBSCD)
As we saw in the previous section, the VB structures of the H3 reaction simultaneously include those of the reactants and the products, with the TS reflecting features of both. If we construct the VB wave function using only reactant structures, we obtain the bonding features of the reactants at a given geometry; conversely, if only product structures are used, we obtain the bonding features of the products. If we perform such VB calculations across the full set of geometries along the reaction coordinate and plot the energies, the result is known as a Valence Bond State Correlation Diagram (VBSCD). A typical VBSCD for the H3 reaction is shown in Fig. 7.3.1 (where the TS is set to zero, the reactants to -10, and the products to +10):
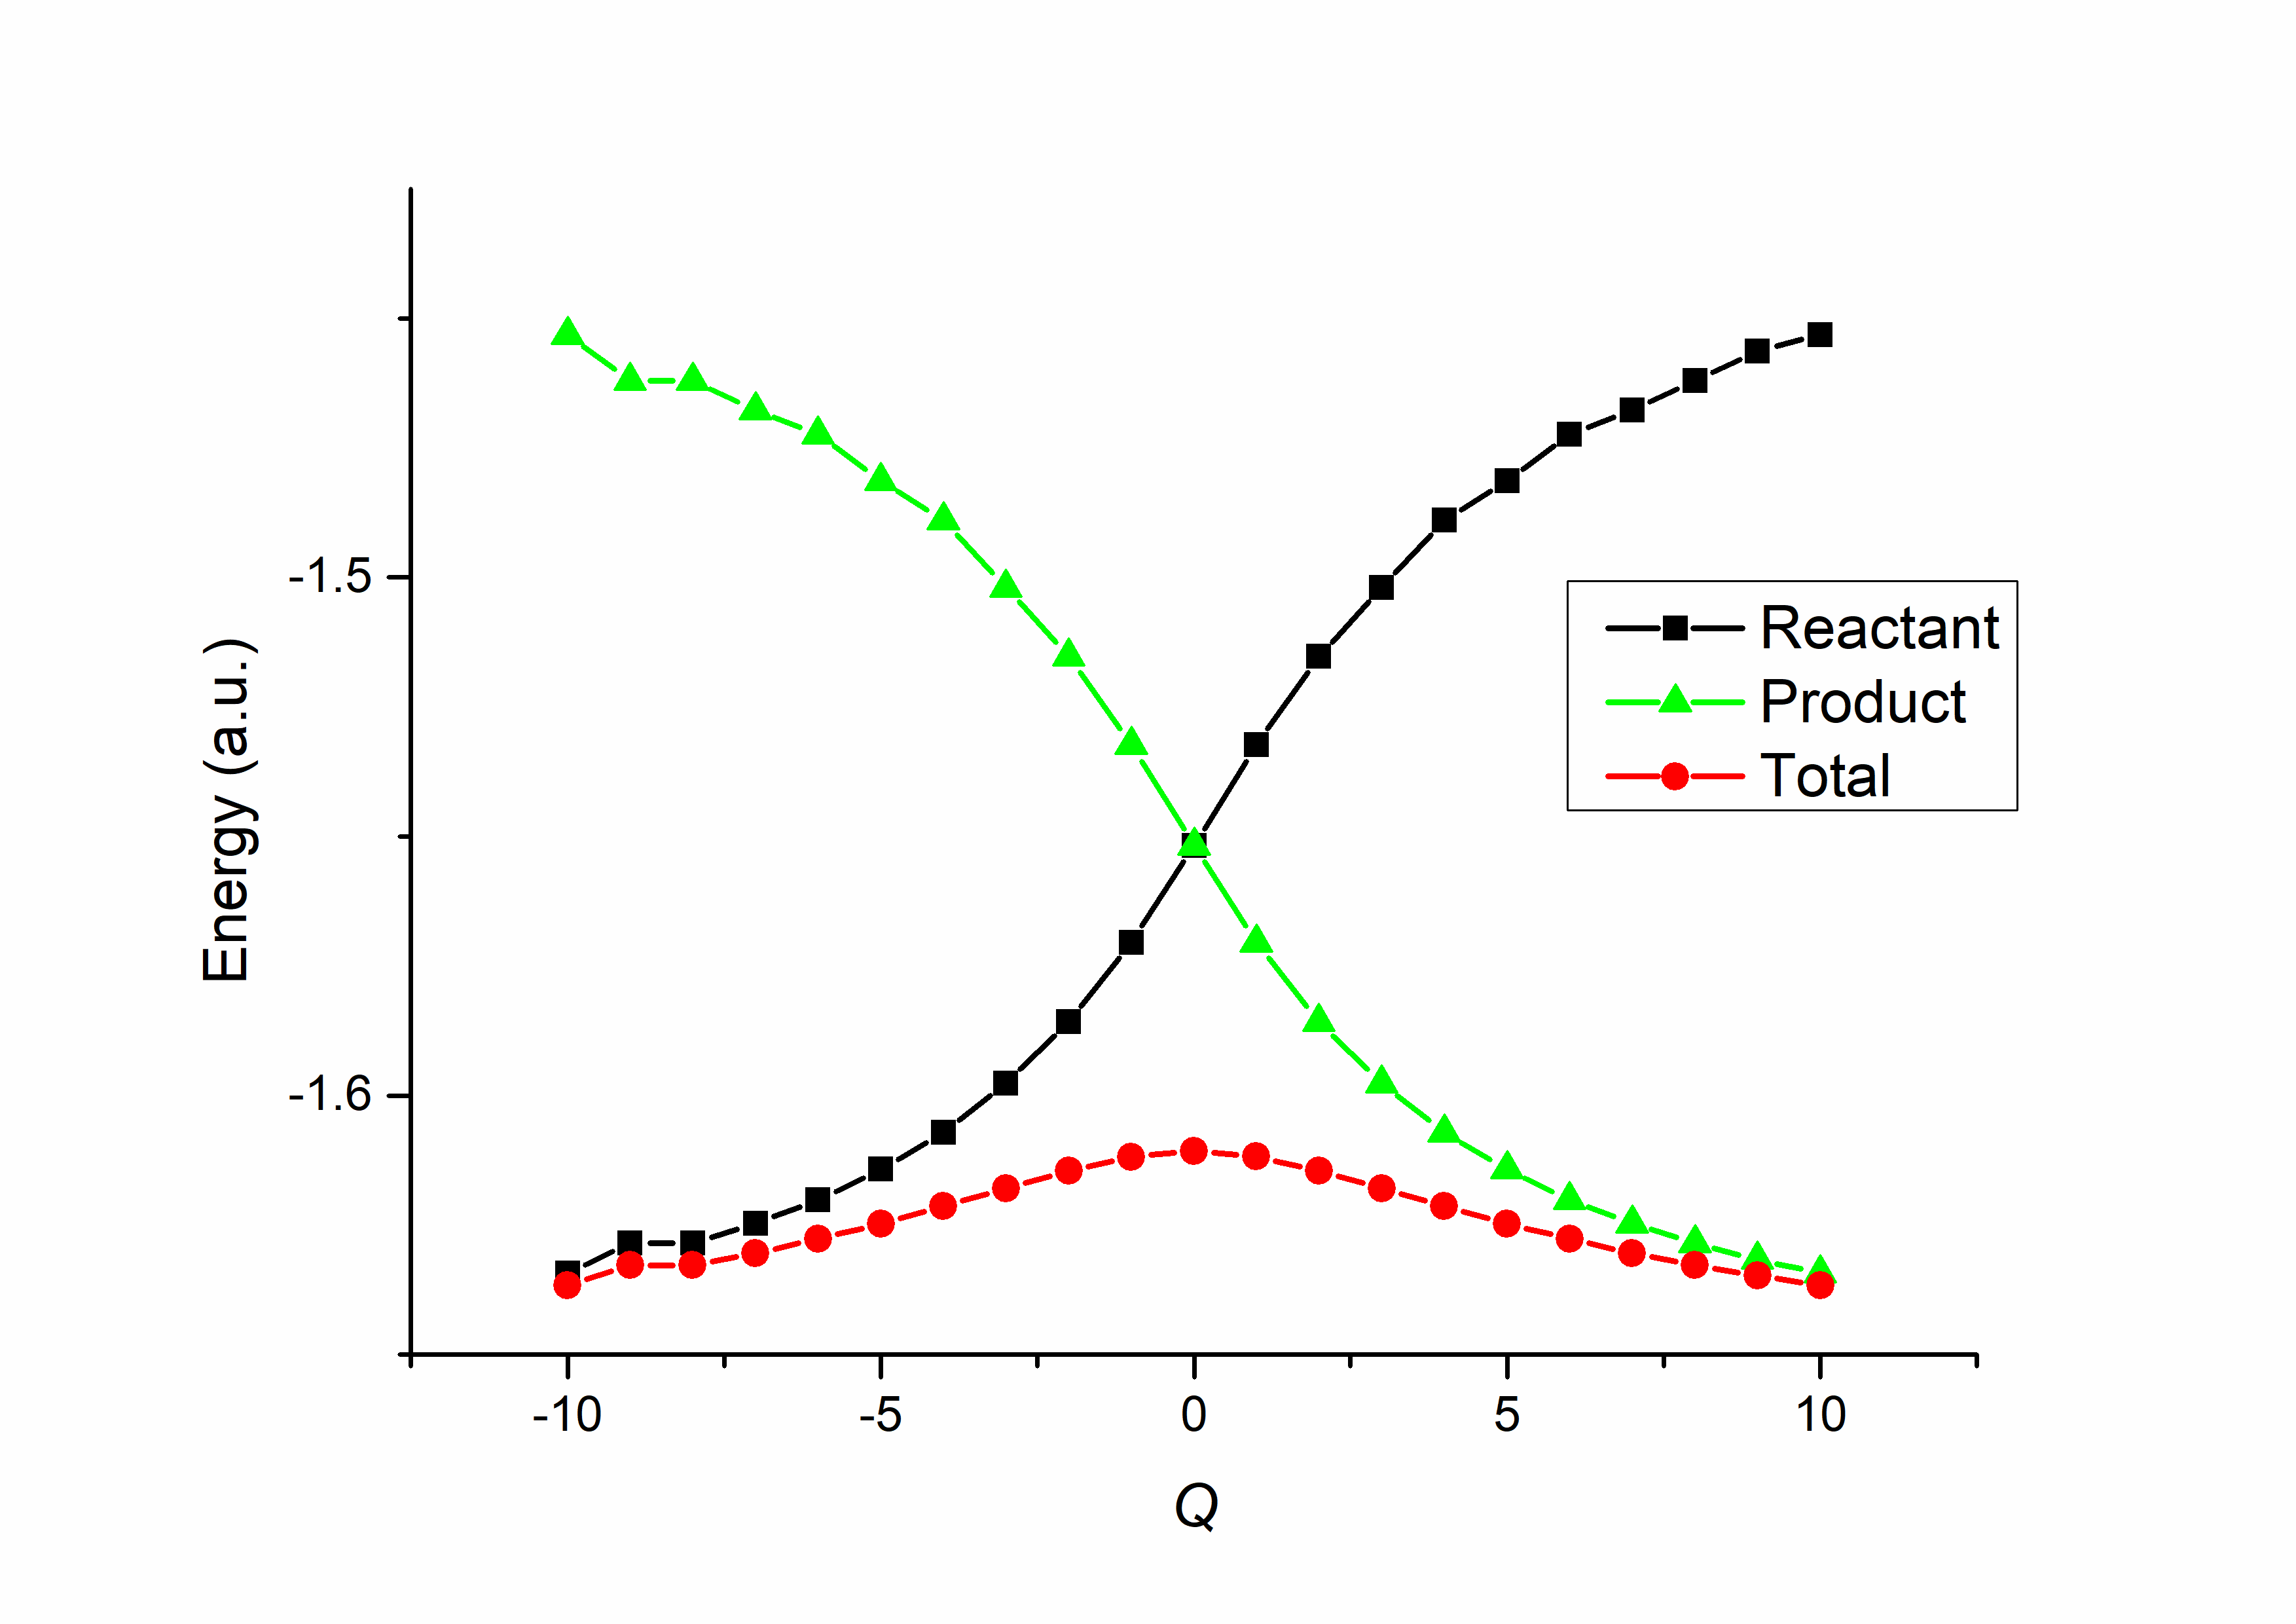
Fig. 7.3.1 VBSCD for the H3 hydrogen-abstraction reaction
The black curve represents the reactant energy, which increases as the reaction proceeds; the green curve represents the product energy, which decreases correspondingly. These two curves cross at the TS, reflecting the fact that the TS has both reactant and product characteristics with equal weights. At the two ends of the reaction, the red curve, representing the total energy, nearly coincides with the reactant and product curves, respectively, indicating that the system is purely reactant-like or product-like in those regions. At the midpoint (TS), the difference between the total energy and the reactant/product curves reaches its maximum, corresponding to the resonance energy contributed by including additional VB structures.
For more details and applications of VBSCD, please refer to the following references: